|
Call Now for a Free Consultation: 678.325.4007
Monday, April 13 2015
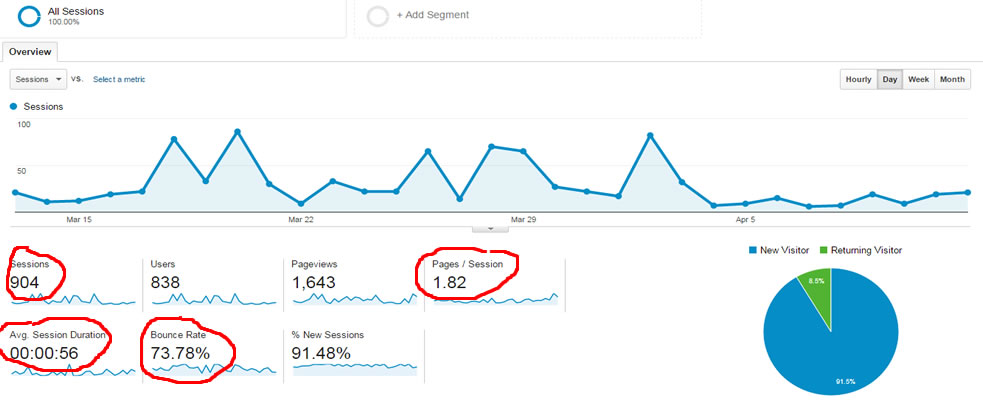
Because of their size, Google sometimes gets a bad rap, but the truth is, when it comes to figuring out how well your website is doing, installing Google Analytics is a great way to get started. In fact, you could insert the obligatory “drinking from the firehose” analogy here when you consider exactly how much data Google Analytics actually gives you. It’s easy to get lost in all that and give up because it isn’t always clear what data is helpful and what’s too advanced for where you are now. We recently held a boot camp where we walked some business owners through some of the basics and takeaways of Google Analytics (GA) so we thought we’d share some of the lesson here. First, if you’ve never installed GA on your site, contact your friendly neighborhood web designer and get that done. Here’s why: without some analytics program, you really have no way of knowing how your website’s doing. It’s like having an employee work for you that you never see, never hear anything from and have no way of knowing if he or she is actually being productive. You need to have an idea of how much traffic your website’s getting as well as some other handy information. So, that’s where we can dive right in. Once you log into GA, you can click on the “all web data” line and that’s where the fun begins (or in some cases, the confusion). Right away Google hits you with a chart of all the traffic your site’s been getting. You can slice and dice that any way you want. Want to see how much traffic you’ve had all year? No problem. Just change the start and end dates in the left corner and your chart will adjust along with the numbers below. From there, the numbers below the chart are very important to consider. In the old days of SEO, you could take a website that, well, let’s just say wasn’t pleasing to the eye (read heinously ugly) and rank it well. Well, along came the Panda update and changed all that. An engineer at Google made the argument that while they were tracking information like Time On Site, Pages Read and Bounce Rate, they really weren’t doing anything with it. He convinced his bosses that these three metrics indicated how well designed the site. His argument was that people don’t stay on ugly, useless sites and they sure don’t read many pages of them. That’s when they started taking these numbers seriously. In fact, you could say these three metrics are now the most important ones to consider after how much traffic your site is getting.
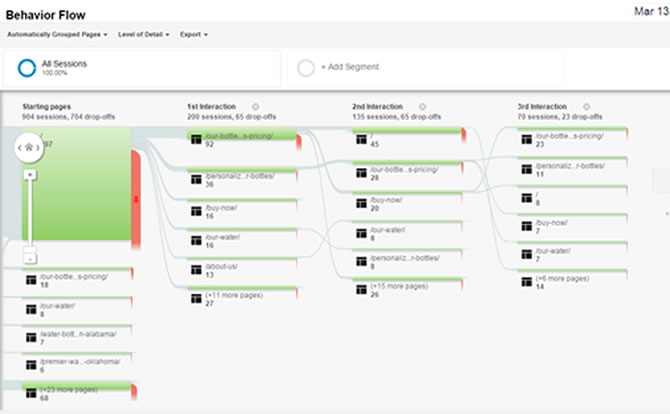
Imagine being able to look over the shoulder and see where people that come to your site click around. There are two ways to do this with GA. One is with the Behavior Flow which lays out where people are going in a flow chart presentation. The beautiful thing here is that you can see where people go on their first, second, third interactions with your site along with drop off rates. You can tell where the majority of your traffic is leaving which gives you data you can use to make some design changes or add content to lower the drop off rates. Also, you can load In Page Analytics and get exact percentages of where your traffic is clicking (and where they’re not). You can even click on the colors and get a heat map of where people are clicking on your pages and elements they’re outright ignoring. Naturally, this is handy information to have because you can begin to make changes on where people are clicking on your site.
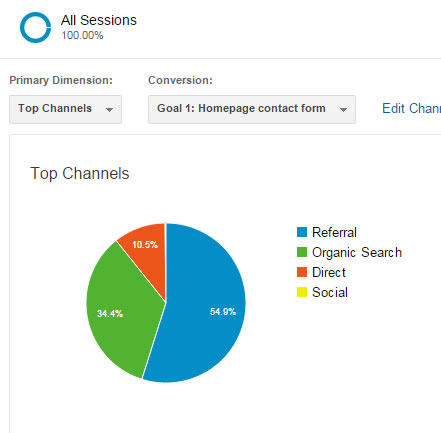
Wouldn’t it be great to know where your traffic is coming from? Act now and you can! Under the Acquisition tab, you can hit Overview and see exactly where your traffic is coming through. Click on each category and you’ll learn specifics like which social media site is bringing the most traffic to your site.
This is only the beginning of some of the practical information you can get from Google Analytics. If you’d like to learn more, contact the staff at Make It Loud. Make it Loud is a digital marketing firm located just outside of Atlanta Georgia that specializes in great website design, search engine optimization, pay per click management, social media management and so much more. We have at least 2 free boot camps every month where we teach local business owners about various digital marketing topics. | ||||


 So, what are good numbers? It really can depend on what you want people to do on your site. Take the time on your site for example. I like that metric to be around a minute and thirty seconds, but if you have a contact form on your homepage (or on every page), that time could be less. You’d want to measure that with the Pages Read metric to try to develop a story as to what the data means. Bounce rate refers to the percentage of people that come to your site and immediately “bounce” off again. I like the bounce rate to be under 50% for most sites. If it creeps too high above that, then you need to look at your keyword strategy. People bounce off sites that don’t meet their needs which means they may be finding it with keywords that aren’t on target.
